Let data science take the wheel.
How Google Maps utilizes machine learning to improve how we navigate the world.
Welcome to Day to Data!
Did a friend send you this newsletter? Be sure to subscribe here to get a weekly post covering the technology behind products we use every day and interesting applications of data science for folks with no tech background.
You pull out your phone, open Google Maps, enter a location, and start your journey. The behavior is so common, it’s almost muscle memory any time I step out the door or get in a car. How does Google Maps know how far until your destination? How does it know what the journey ahead entails? What’s the data that powers these processes? Let’s discuss.
Today’s article was a topic recommended by a reader! If you have a topic you’d like me to discuss, let me know by commenting or sending me a note!
Arriving on time.
Getting somewhere on time can be a high-pressure situation. Providing dependable ETAs is something that Google Maps has to perform every time a user enters a new destination. We talked in our newsletter about Uber how they have worked to improve ETA estimates in terms of when a rider should expect their driver to arrive.
Google has a similar need, to make sure that users know when they can expect to arrive at their destination. As of 2020, Google was consistently accurate for over 97% of trips. What types of data inform a model that can make a decisions as accurate as this?
User congestion data
With a quick dig through the Google blog archives (literally hosted on Blogspot LOL), there’s an article titled “The bright side of sitting in traffic: Crowdsourcing road congestion data” from 2009. The author poses the idea of:
“…if everybody on the road, all at once, could tell the world how fast their car is moving, and we could make it easy for anybody to check that information on their computer or cell phone, well — then we'd be getting somewhere.” — Dave Barth, Product Manager for Google Maps
By driving with Google Maps and an internet connection, Google anonymizes driving and location data through the aggregation of data points sent from your phone regarding speed, position, and time. Your speed, and the speed of drivers around you using Google Maps, enables the crowdsourcing part of congestion data. The more drivers using Google Maps, the better. This need for users to provide more data is likely a big part of Google’s 2013 acquisition of Waze, the crowdsourced navigation platform, which has been operating as a standalone app since the acquisition.
An interesting anecdote about this process is that using data from a phone can be hard to analyze, as your phone can move throughout the car and be all over the place. When a phone display is projected to a car display, the location then stabilizes and Google can better detect slamming on the brakes, traffic jams, and those incidents.
Historical traffic records
When it comes to traffic, some of the best ways to predict conditions is simply looking at records from previous days, weeks, seasons and other comparable times. With 16 years of historical data, and over 1 billion kilometers driven every day, Google Maps has plenty of historical data. However, in 2020 with the onset of the pandemic, Google Maps saw the importance of prioritizing recently collected data over years old data that did not represent societal shifts affecting traffic conditions. With dramatically less people on the road, data from the prior week became far more relevant than data the year before to predicting traffic. Based on their real world observations supported by the data, Google shifted their models to adapt to such situations.
Predicting ETAs today.
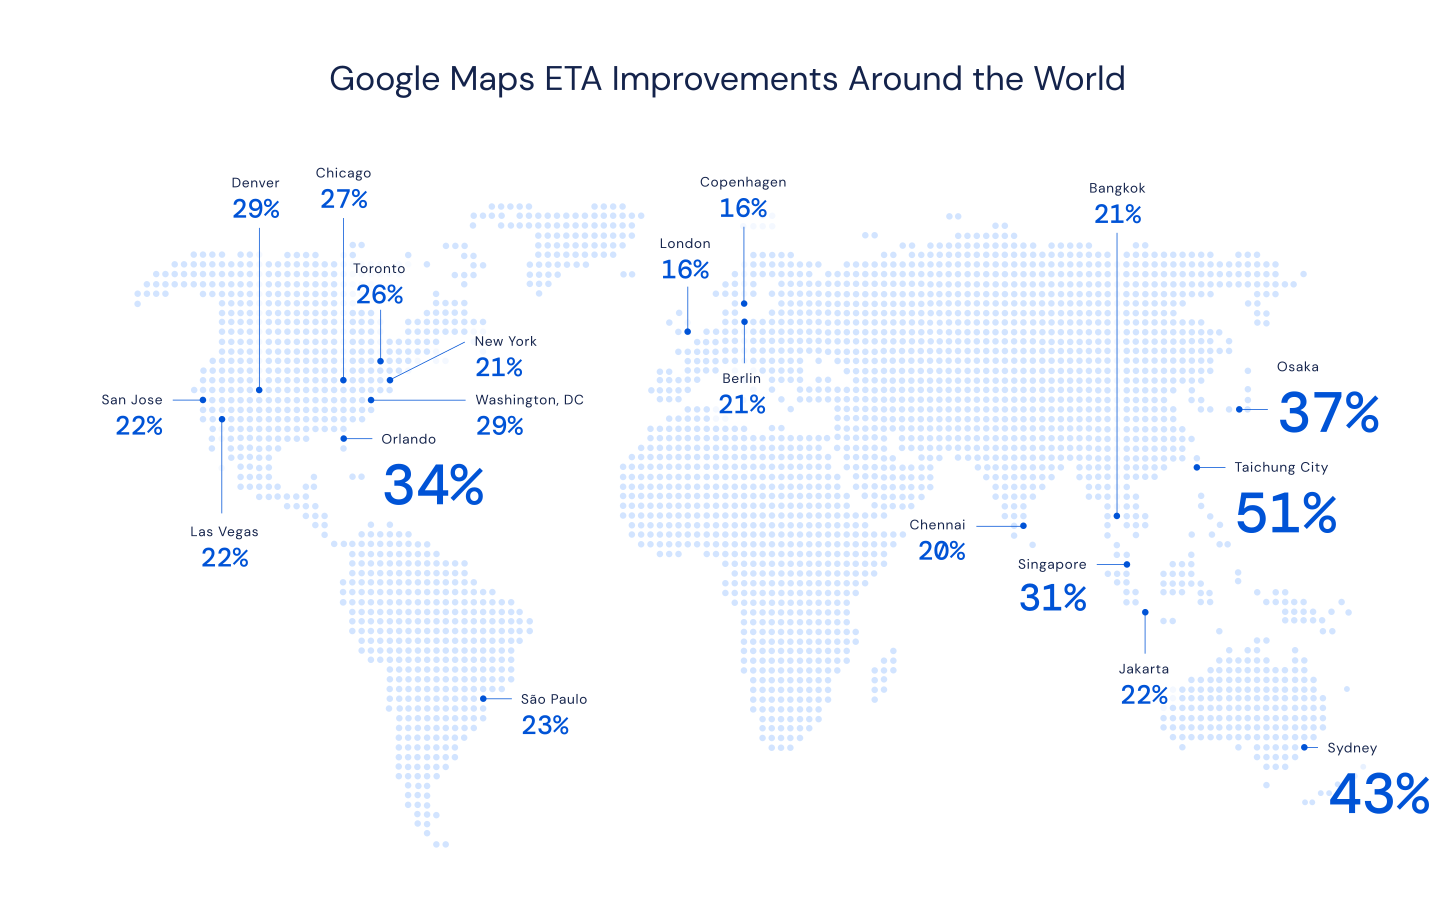
Since the launch in 2005, Google Maps has evolved its approach to ETAs tremendously from the methods shared today. In 2020, the company launched a collaboration with DeepMind with the goal of improving accuracy on ETAs across the globe. By implementing Graph Neural Networks (GNNs), ETAs were able to improve accuracies of their already impressive predictions, with major successes in Taichung City, Taiwan and Sydney, Australia. Their approach included dividing road networks into “Supersegments”, which represented several segments of road with specific distance and speed attributes. Their model uses graph representations of road networks, where Supersegments are subgraphs that travel time would be estimated for. Traffic made for a good use case for GNNs as they can model information propagation and be agile to changing conditions. Read more about the partnership here.
Google Maps takes Mont Blanc
Through partnerships over the years, Google has taken Maps to some new heights. In 2015, Killian Jornet, a seasoned and decorated trail runner, alpinist, and adventurer who holds the speed record of 4 hours 57 minutes for ascent and descent of Mont Blanc, journeyed up the mountain to capture the climb, which can now be viewed on Street View.
Thanks for reading today! There’s lots more to dive into here, and I’m excited to continue the conversation in later posts! Happy Sunday!


