$120 for a ride home!?
How Uber gets people, food, cargo, and pets from point A to point B using the power of data science.
Since moving to New York from Los Angeles, I was thrilled to be in a place with lots of public transportation and ditch my Uber habits along the way. However, the occasional out-of-borough trip or night time cross town ride leads me opening up the Uber app and saying, “Ugh, this ride is HOW expensive?!”
Uber launched in 2009 in San Francisco. Since their humble beginnings, they’ve exploded to almost 1.5 billion rides a quarter. There was a time when every startup wanted to be “the Uber of” a new sector. They’ve had moments of being the Silicon Valley poster-child followed by moments of scandal, but regardless Uber still finds itself with 93 million users hailing rides in 2023.
Uber is driven by data (rideshare app pun intended). Uber’s data science teams cover everything from rider safety to whatever “customer obsession” means. Today, we’re peeling back the layers on some of the data science that gets drivers to your doorstep and keeps the Uber experience top notch.
Machine learning as a service
In 2015, machine learning wasn’t being used to its full potential at Uber. With complex services, a growing company, and expanding dataset, there was a clear step forward for Uber to use machine learning to transform their business. So what did Uber build to enable the training and deployment of models at the scale they needed? Michelangelo.
The hope was to build a product to productionalize a handful of machine learning models but has since scaled to house tens of thousands of models that make ride ETAs accurate, match you to the best rider, and make sure that your food lands at your door while its still hot. Michelangelo was a platform built to respond to the growing need for machine learning to augment use cases across the company.
From Uber’s engineering team — “While the goal of Michelangelo from the outset was to democratize ML across Uber, we started small and then incrementally built the system. Michelangelo’s initial focus was to enable large-scale batch training and productionizing batch prediction jobs. Over time, we added a centralized feature store, model performance reports, a low-latency real-time prediction service, deep learning workflows, notebook integrations, partitioned models, and many other components and integrations.”
The decision to build internally.
People might look at this and say, “isn’t there a vendor that should do that for Uber?”. The choice to build in house is costly, time intensive, and a long term investment in maintenance and talent. Companies like Databricks offer end-to-end solutions much like what Uber is building. There are varying ideas around what’s the best approach, with tools built internally allowing for a competitive edge, customizations, and less roadblocks typical with vendor onboarding. Buying vendor software typically lends to extensive documentation, lower costs of maintenance, and an excess of developers building out improvements. At a company with the engineering power and unique problem area like Uber, building internally made the most sense to enhance their ability to do ML at scale.
“[Machine learning] is this cyclical process on how you can use data to effectively create these smaller-scale decision systems that ultimately allow you to operate Uber at the scale we do” — Logan Jeya, PM at Uber
Machine learning use cases at Uber
Uber’s driven by data, but what specific parts of the platform are thanks to machine learning? How are users digesting the results and benefits of machine learning? The use cases and applications are vast, but we’ll dive into two today. I could (and just might) write 10 more articles on data science at Uber alone!
Marketplace forecasting
Forecasting is a common problem for statistics applications. Forecasting hopes to provide an insight on what to expect in the future for better preparation. At Uber, forecasting can take many forms. Marketplace, Uber’s real-time algorithmic decision engine, uses forecasting to estimate user supply and demand to guide drivers to areas with the most demand, therefore increasing their trip count and earnings.
Spatio-temporal forecasts
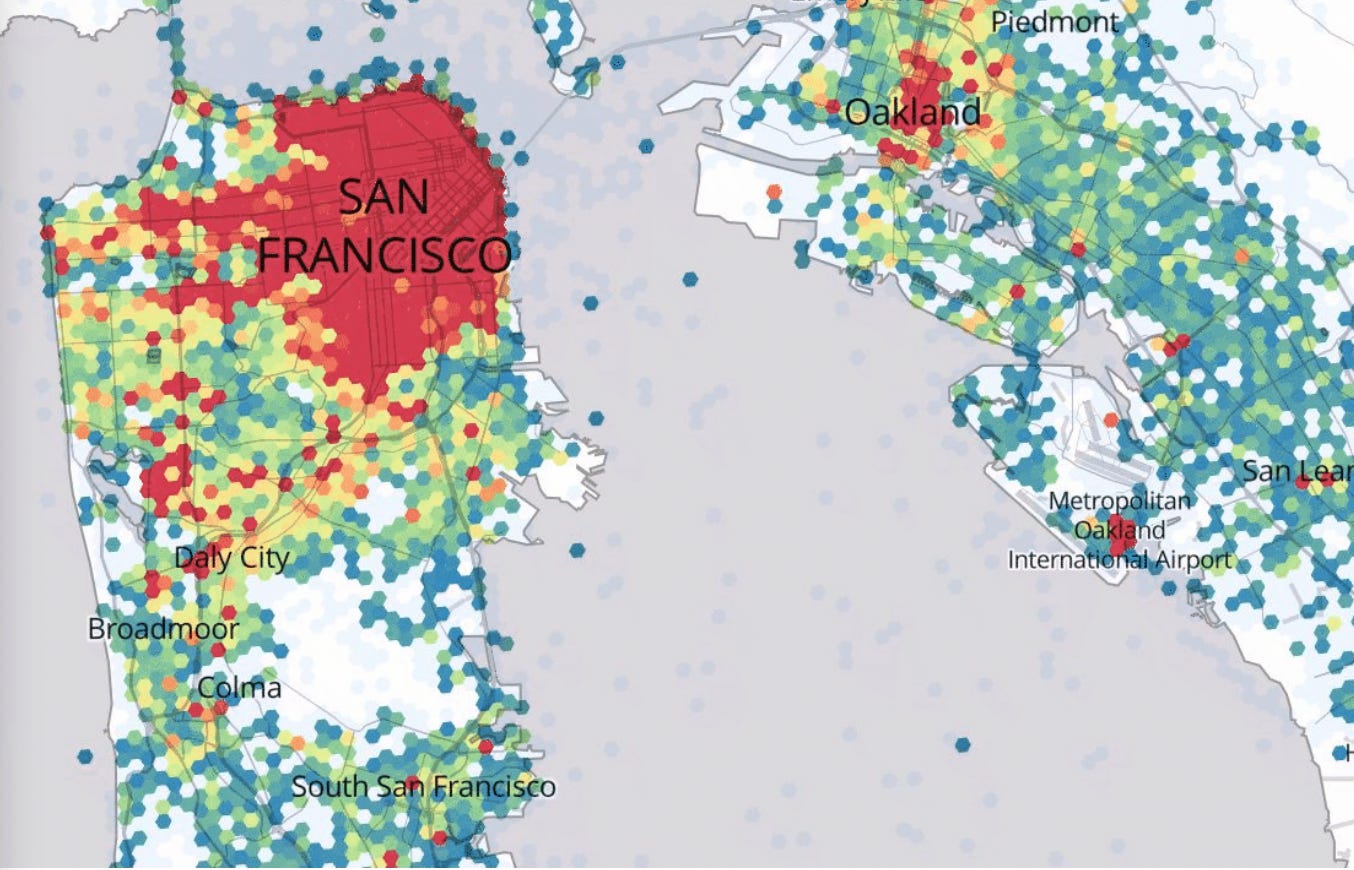
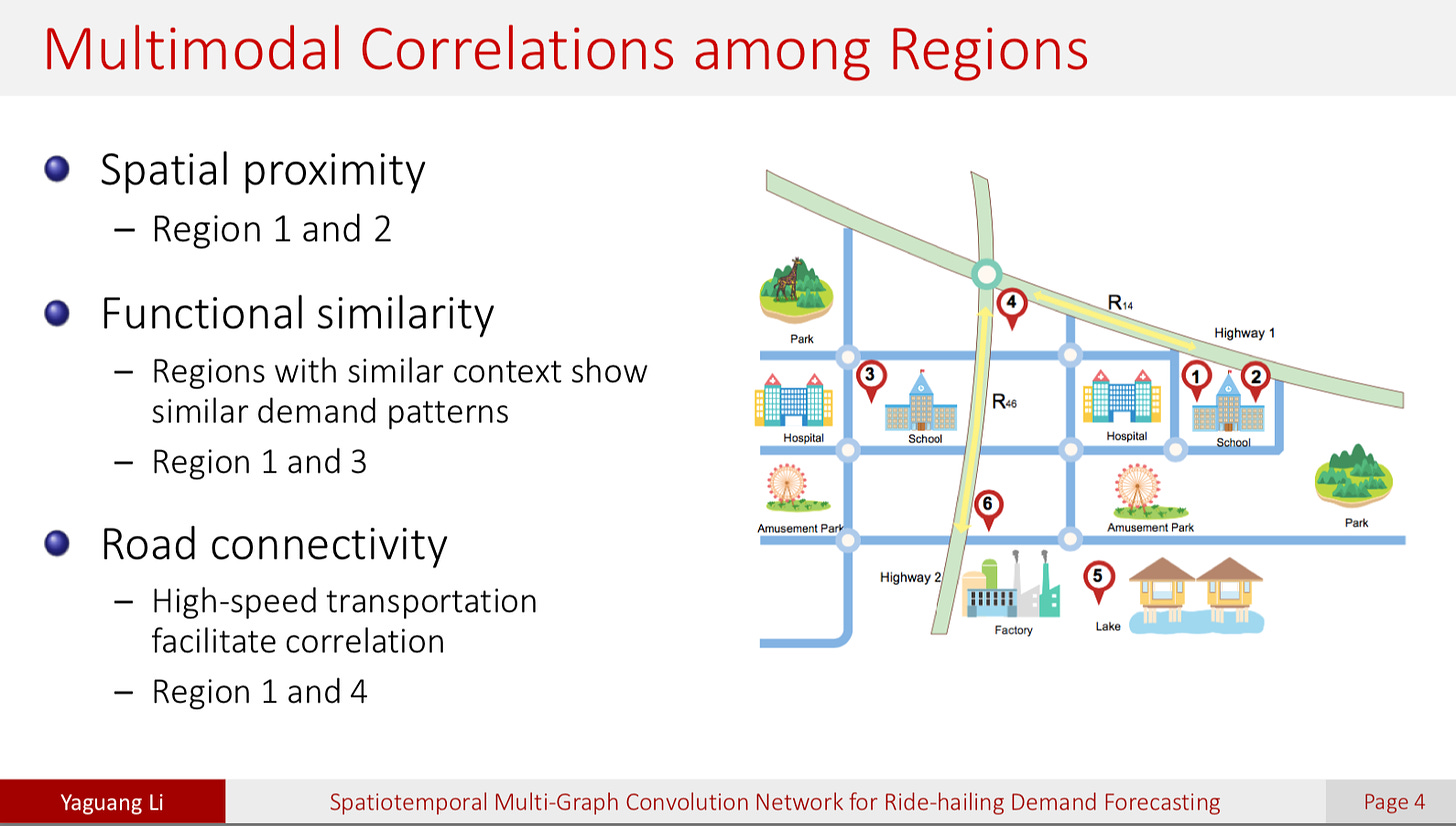
Big word, I know. Spatiotemporal breaks down into space and time. Uber data is particularly interesting because their data exists in the physical world. They’re gathering data points around how the cars and drivers are moving through the world, and how to optimize those movements. Spatiotemporal forecasting can use correlations in regions such as spatial proximity (two areas nearby may have correlated demand), functional proximity (two schools may have similar demand patterns by time of day and season of year), and road connectivity (two spots on a major highway may show correlation). By gathering data on usage patterns, rider history, and also the context of how a region is configured, Uber is able to make spatiotemporal forecasts to move get drivers to the right place at the right time.
For a deeper dive on forecasting at Uber, I’d recommend reading this article from their engineering team.
Estimated time of arrival (ETA)
ETA functionality can make or break a user’s experience with a rideshare app. It’s also an area where Uber puts data science to work to make sure the time you’re shown reflects when your driver will arrive as accurately as possible. ETAs are also really hard to get right. As a data scientist myself, trying to think about how to accurately predict the time until your driver arrives seems like a really challenging problem. With machine learning, it seems nearly impossible.
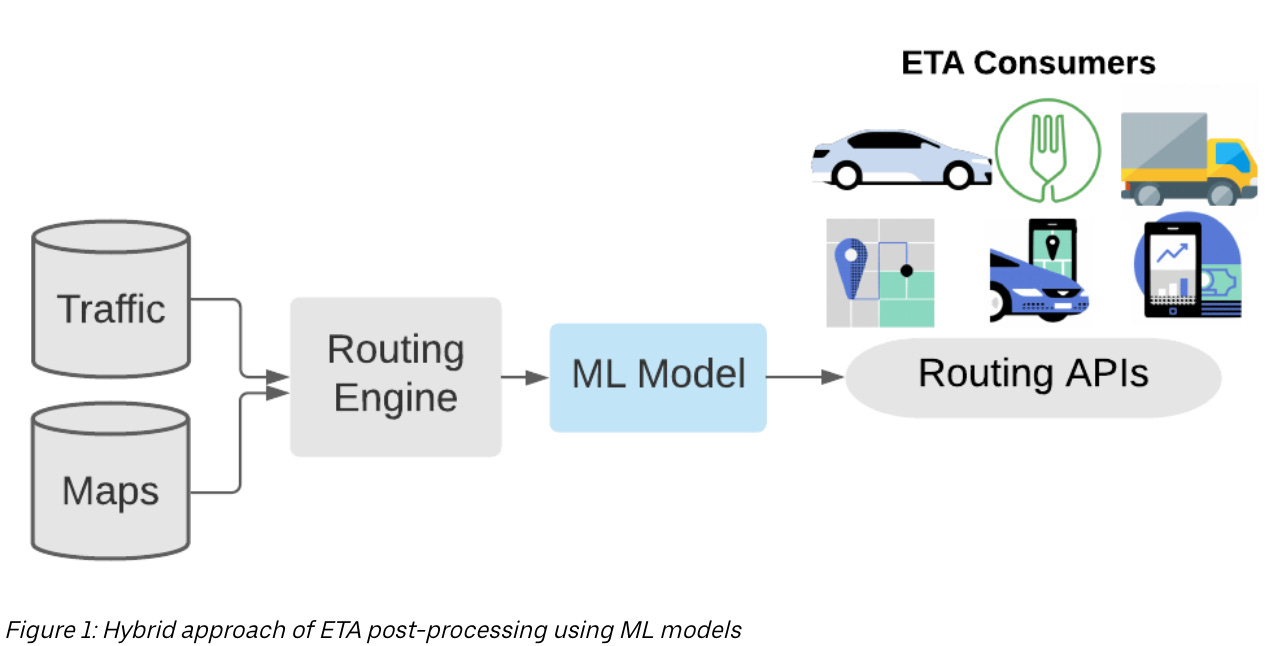
Traditional routing algorithms used graph representations of roads to break down the route into smaller segments, find the shortest path between those segments, then add up the weights of each edge (which represent the time to travel that edge) to arrive at an ETA. However, this simplified approach doesn’t account for a slew of real world conditions that lead to less accurate outcomes. Uber was using gradient-boosted decision tree ensembles on XGBoost to refine predictions, supposedly building one of the largest and deepest XGBoost ensembles in the world at the time.
Uber needed to improve accuracy by looking back on the patterns they observed and reduce errors in the predicted ETAs versus observed ETAs. In 2022, researchers at Uber developed DeeprETA, an ETA post-processing system that enhances the accuracy of ETAs.
What’s post-processing mean in this context? In machine learning, we typically see how well we can predict an outcome, like a driver’s ETA. That point-in-time prediction is made and then after the driver arrives to a rider, there is a real value for the ETA (also called an actual time of arrival, ATA). The difference between the ETA and the ATA is an error. Post-processing is deploying another model to predict that error. If you can get good at predicting an error, you can improve the likelihood that the error is as close to zero as possible.
From the research, “DeeprETA post-processing system aims at predicting the ATA by estimating a residual that added on top of the routing engine ETA”. Not only is the model incredibly powerful, but it is so fast as these predictions have to happen on the fly for billions of rides. At the time of release, DeeprETA had (and still might have) the highest queries per second of any model at Uber, simply meaning it is doing a lot in a really fast time to make sure your ETA is really close to accurate.
Get your own Uber data.
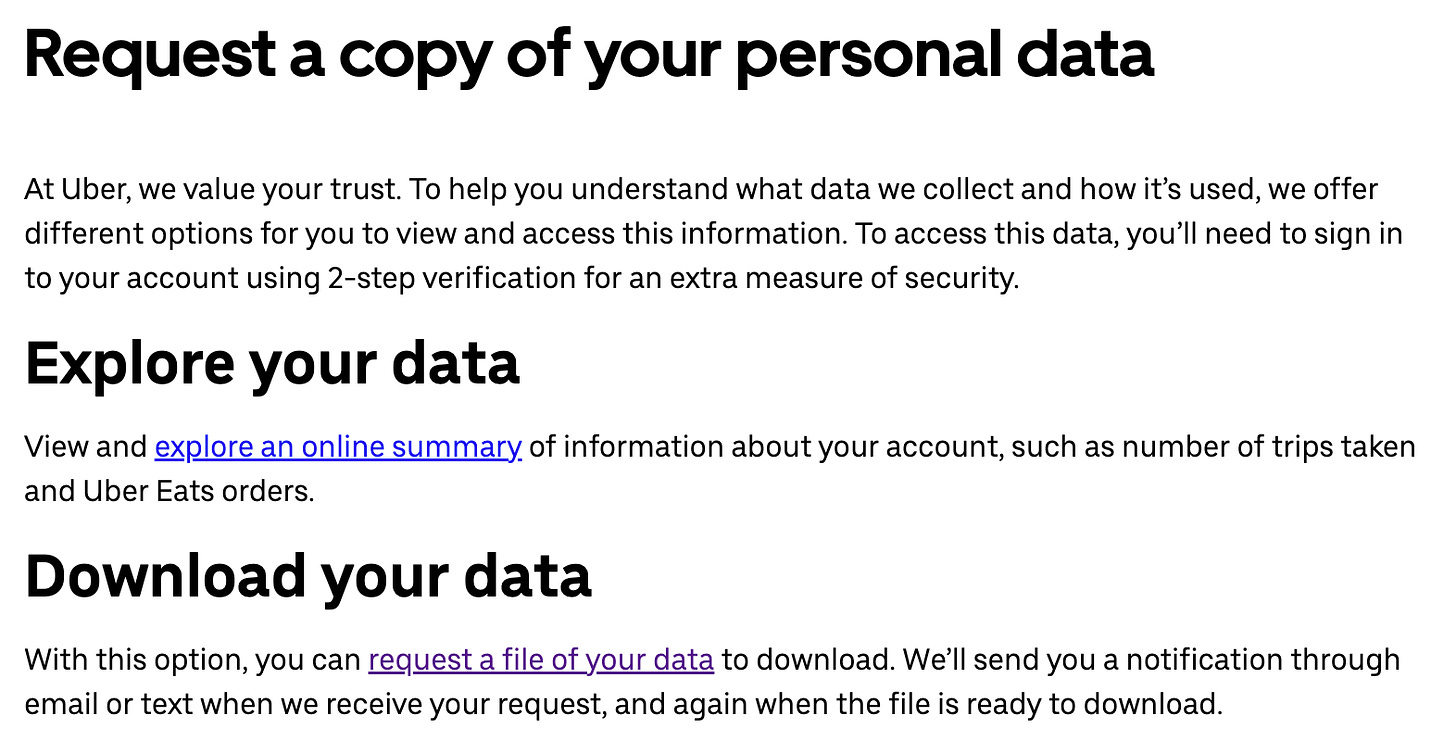
A fun fact about a lot of platforms is, if you have an account with them, it’s likely that you can download your data to get a sample of your records with the company. With a sign in to your Uber account, you can request an archive of your Uber data, including Rides and Eats.
I’ll share my findings perhaps in another post, but I think I need to use Uber more to increase my sample size. My astonishing total 3 Uber Eat’s orders in the past 7ish years definitely don’t show anything statistically significant at the time. Happy analyzing!
For your enjoyment.
With some great engagement after last week’s edition of app recommendations and niche articles to read, here’s a few snippets from this past week:
Pickleball’s expensive noise problem: The sport that is exploding in popularity is also way too noisy. Meet Bob Unetich, 77 year old retiree turned pickleball sound mitigation consultant, who’s tackling the sport’s noisy problems.
Luxury living for the Waystar-Royco crew: With Succession coming to a close (what am I supposed to do tonight?), anyone looking to get their hands on relics from the show can indulge in all the real estate where pivotal scenes took place. Roman and Kendall’s season four pads are up for sale for anyone eager to dive in.
Thanks for reading!
Thanks for reading this week’s Day to Data. 5 months of writing this blog, and I’m excited to keep going. Always open to feedback, ideas, questions and more. Thanks for being here!


I think ‘customer obsession’ is pretty intuitive if not an exaggerated claim to an emphasis on customer service. As to the ‘buy or build’ decision for their c ad of tears, my sense is that Uber started out as a less expensive, more flexible alternative to taxis, but they learned (or morphed into) a company that could do an even better job if they mined all the data their billions of rides produced.