Winning the World Cup with data
How teams are using data analytics to win games and keep players injury free.
Welcome to Day to Data!
Did a friend send you this newsletter? Be sure to subscribe here to get a weekly post covering the technology behind products we use every day and interesting applications of data science for folks with no tech background.
An estimated 6.43M people watched the USA play the Netherlands in the Women’s FIFA World Cup on July 26, 2023, breaking the record for the most-watched group stage match in women’s FIFA World Cup history for an English-language broadcast. The World Cup is one of the biggest international stages, for one of the most popular sports in the world. The men’s and women’s tournaments have come a long way since the first World Cup in 1930. The broadcasts are higher production, better quality, and more data-driven than ever. The integration of sports technology into the game has changed the way that teams stay healthy, improve performance, and analyze athletes.
Today, we're talking about the data behind the world’s greatest tournament (in my humble personal opinion).
Data is a key player on the field
With the push towards broadcasting more sports games from all around the world in combination with the rise of data science and analytics, data has become more present than ever in the viewer’s experience of major events. Much of the modern sports broadcast consists of on-screen metrics like average miles run per player and possession broken down by team. Analytics are embedded into the entire sports ecosystem these days.
In recent years, (American) football has been leading a major charge on not only use data as a tool to win games, but recruit players and help teams make it to the Superbowl.
As recently as 2020, the Washington Post reported that the National Football League’s analytics efforts had finally reached mainstream, despite their analytics department existing since the 1990s. The governing body started sharing out league-wide data, sharing statistics like how to tire a defensive tackle or the size of a window a quarterback can throw into. This data supplied teams with knowledge in a widely measured area that enhanced their abilities to better understand their players, their opponents, and build a winning team.
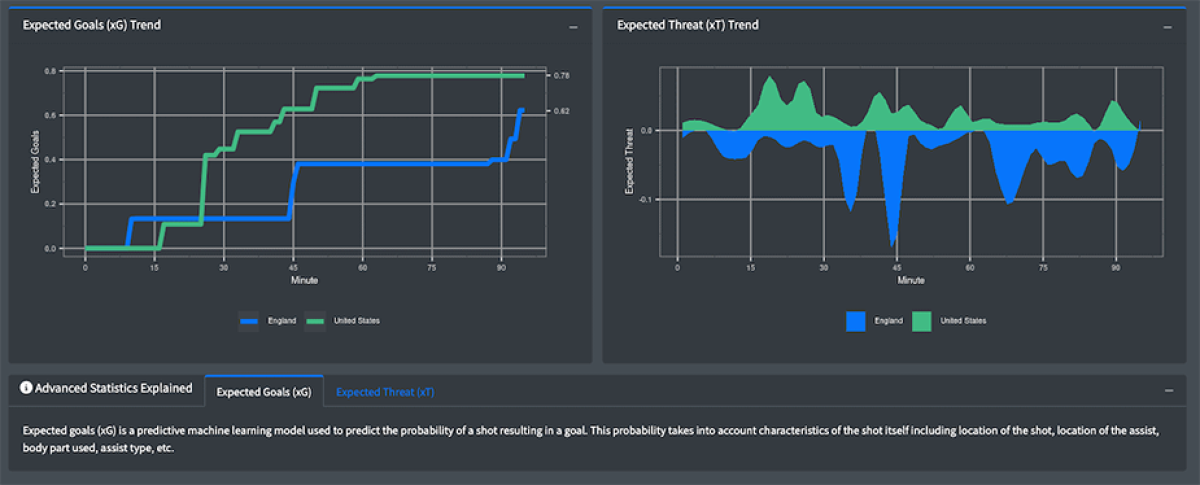
Soccer is having its moment with data too. Wearable technology is improving rapidly. Companies like Wyscout help provide managers with data to monitor player and team performance, and arrange offensive and defensive strategy. Startups like First Team Analytics are working to “modernize the world’s game”, helping teams “win with data”. They’ve worked alongside the University of Denver’s men’s soccer team to analyze performance and build off data from Wyscout to improve the university’s scouting tactics. First Team launched an analytics dashboard reviewing data from the men’s World Cup last year to test out metrics like Expected Threat and Expected Goals, broken down by team over the course of the game.
How to gather player data
In a last week’s post on WHOOP, we discussed how wearables are a valuable way to collect comprehensive physical data on a user. Gathering player data in professional soccer, as well as other sports, happens in a variety of ways:
Global positioning systems (GPS) tracking player movement
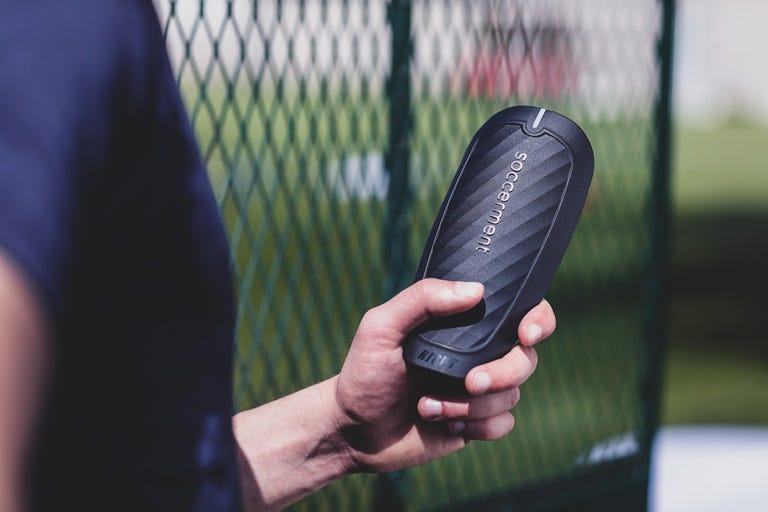
Wearables on the shoe, chest, wrist, and even data-gathering shin guards
Analysis of video broadcasts by computer vision software
LOL. One Scottish soccer team’s camera with “in-built, AI, ball-tracking technology” confused a bald referee’s head with the soccer ball, leading the camera to follow the referee rather than the ball.

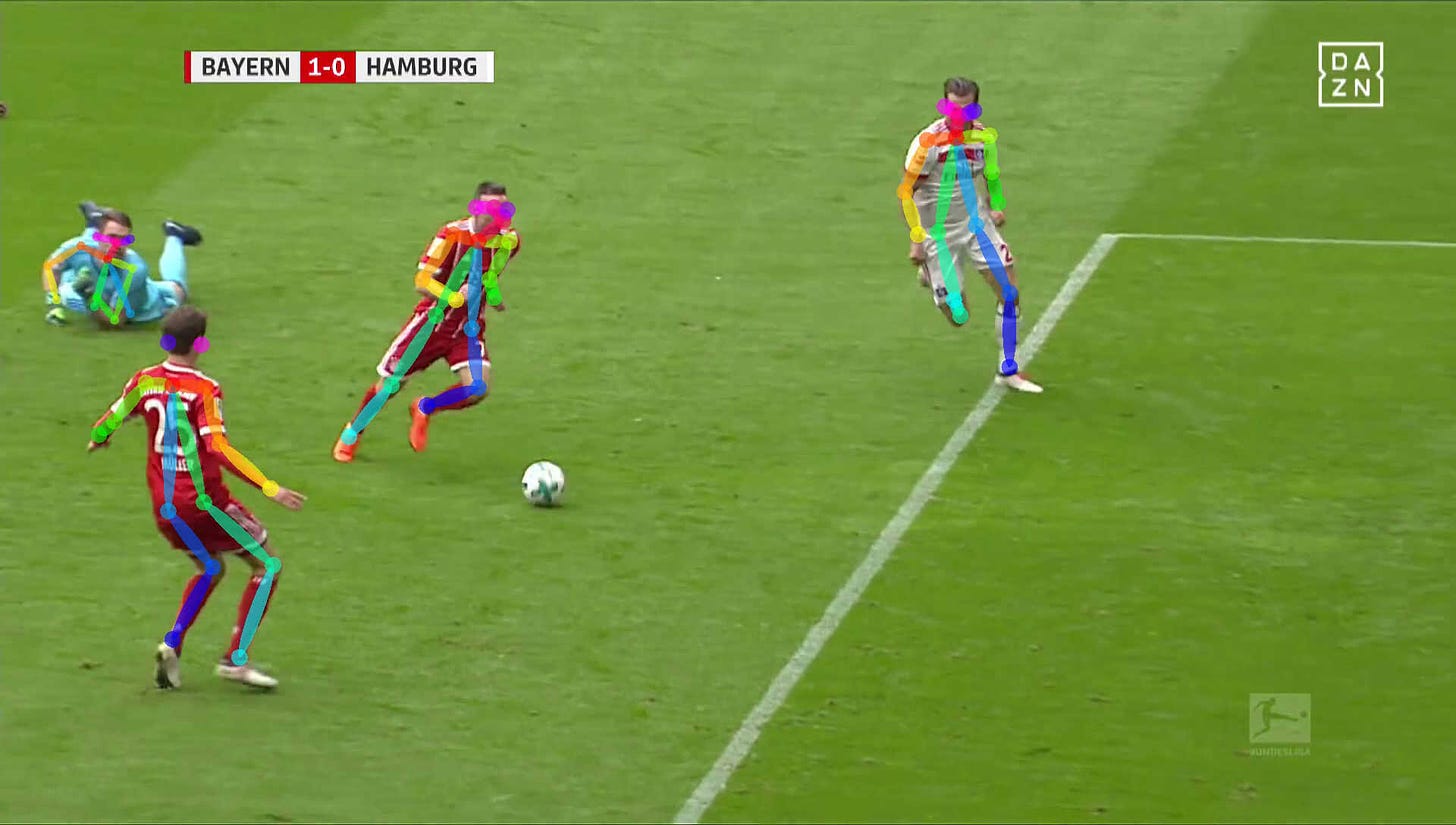
Body tracking from match footage
Soccer teams record a lot of footage. This footage is a rich source of visual information.
Researchers in Germany and Barcelona (and likely labs all over the world) have proposed their findings around extracting player positioning from match footage, using incredible algorithms to process the visuals and convert them into machine-understandable insights. One approach of these extraction softwares is to focus on the center of the player, as it is the spot of the least movement. From this center point, algorithms try to detect what pixels represent the player, versus what represent the field (the pitch!) behind them. It becomes more complex when you have players passing alongside each other, the ball moving rapidly, and overall, a quick pace of game play. With an understanding of what pixels make up the player versus the pitch, the algorithms will try to establish a sense of where the players’ arms, legs, and head are and how they are moving through space. These data points are all collected and ripe for analysis about player performance and team dynamics.
Some complications you might not have thought of?
When the footage includes the shots of the sidelines — all the sudden you have several more bodies than expected and it can be tough for the software to decide which team these players are on.
If both goalkeepers are in a shot (which is very rare), their different jersey colors need to be addressed by the software ahead of time.
Developing training plans
In the game of soccer, each player serves a different purpose. Your midfielders run far more than your goalie. Your defenders may be doing more slide tackles and your strikers may be doing more short sprints. By monitoring how different positions exert different amounts of energy at different points in the game can help improve training programs for soccer clubs. Researchers at Chelsea Football Club Academy analyzed activity demands of a sample of athletes to measure positional differences in training and matches among players.
Injury prevention
The data analytics team at NYC Football Club uses player level data to see how injuries could be prevented among their athletes. Let’s say a player develops an injury during a game in July. The data around the player’s time on their feet, miles run, heart rate variability, and other bio data from the months leading to the July injury can be analyzed to detect patterns or behaviors that may have led to the injury. When patterns and behaviors are found, these triggers for injury can then be monitored in other players that may be susceptible of a similar fate later on.
And more, for extra time
An interview with several analysts at soccer clubs explaining how their analysis impacts the teams they work with.
Dan Fadley, a data analyst at New York City Football Club, discusses how they use data to improve their team’s performance.
Kicking into a higher gear
Data can empower teams to make more informed decisions, from how they strategize in each match to how they keep players injury free. From the broadcast to the locker room, data is becoming more prevalent to athletes everywhere, and it is providing a competitive edge to those that are adopting the technology. I’m writing this before the women’s World Cup final, but I hope the data from the match is exciting!


Just watched Spain eke out a 1-0 win over England to take the World Cup. I wonder how the teams at the tournament compare in their use of data. Spain appeared to use the Barcelona strategy of sharp passing and in your face defense. The difference in success and failure comes down to millimeters and milliseconds in a 90-minute (in this case, 103 minutes) match. I wonder if a critical incident analysis might be useful, with a focus on key plays and actions, might also be beneficial.