how do i know everyone in new york somehow?
The small world problem, network analysis, and how to use networks to uncover interesting relationships in your data.
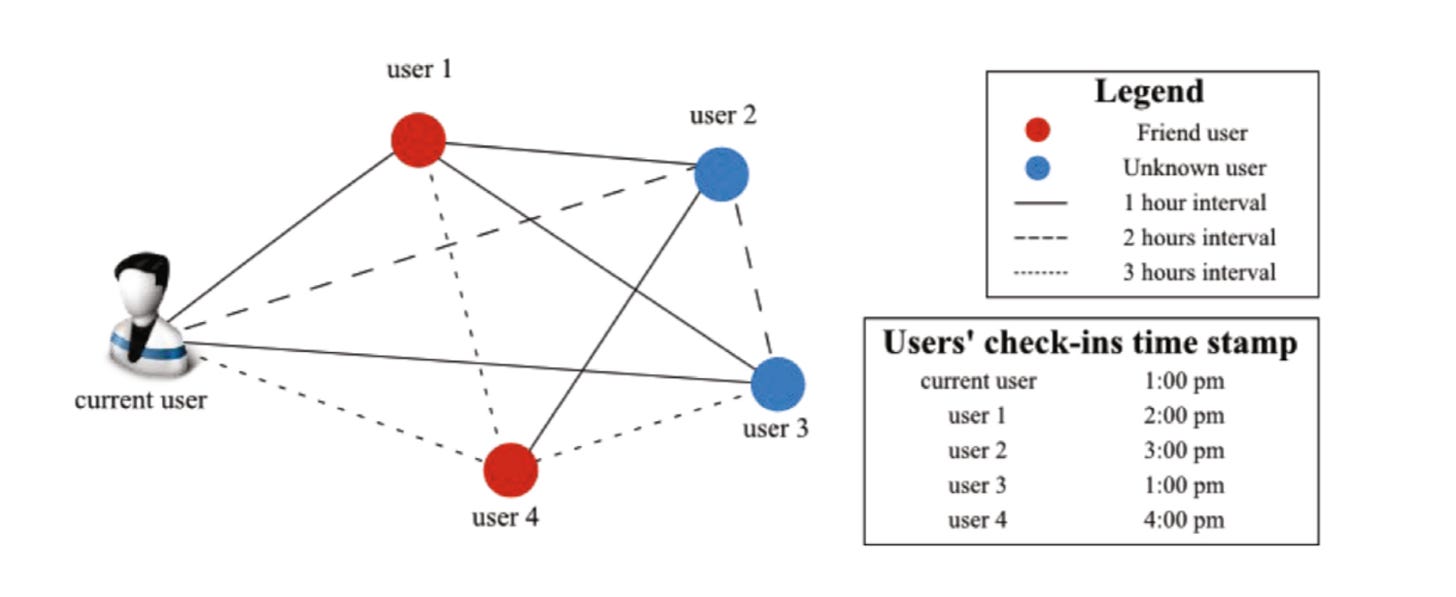
Since moving to a new city, I’ve spent a lot of time meeting new people. I’ll be on a run, spending an afternoon in the park, or in a bar, and chat up someone new when I find out their best friend from home’s college roommate is my coworker. We can always find a common thread.
This idea has a term. It’s called the small world problem, keyed by Stanley Milgram in his 1969 paper. He selected 296 people in Nebraska and Boston to create an “acquaintance chain” to get to a selected individual in Massachusetts. Successfully, 64 people created a chain to the person in Massachusetts, with an average of 5.2 people between the start individual and target individual. And there’s the foundations for the “6 degrees of separation” that separate me and my new friend I met while sitting in Central Park.
networks, simplified
To talk about networks, here’s the terms you’ll need to know:
A node is an entity, the most fundamental element of graphs
An edge is the link that connects one node to another
A graph is a set of nodes and their edges, which represent connections to each other. The term graph will be found more often in the mathematics space, while network tends to be used more in practical applications. The terms are interchangeable.
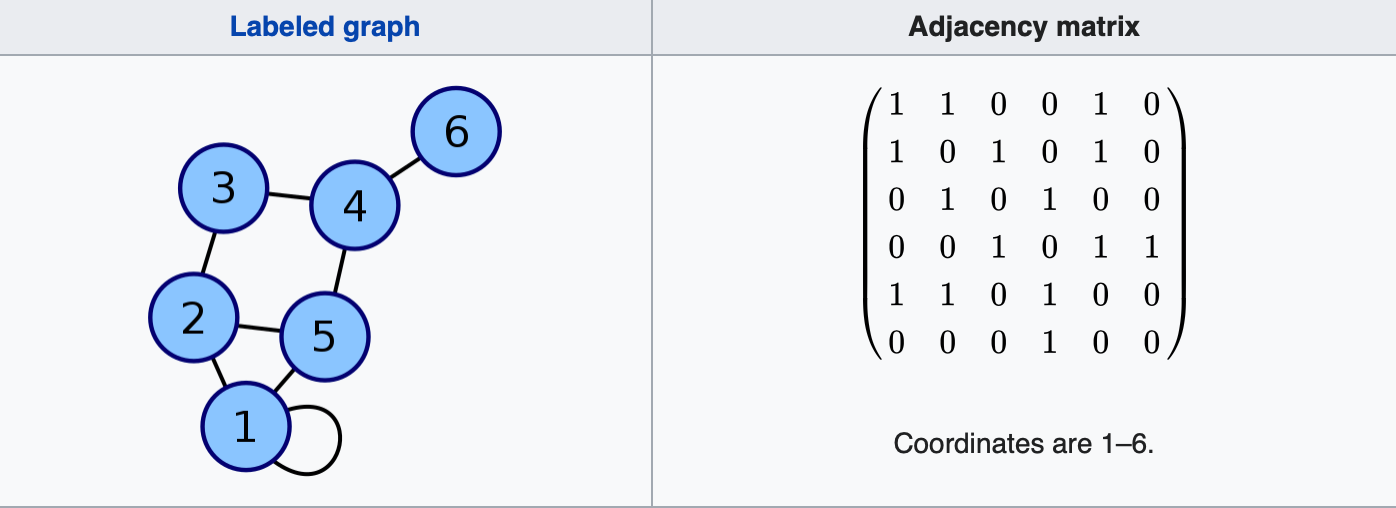
An adjacency matrix is a mathematical representation of a graph. In its simplest form, a 1 represents an edge existing between two nodes, while a 0 represents no edge between the two nodes. As shown in the image below, an edge can even exist between a node and itself!
Want to deep dive into networks and connectivity? Check out this online textbook published by Cornell for a comprehensive review of networks and the interesting problems we can solve with them.
how are networks being used today?
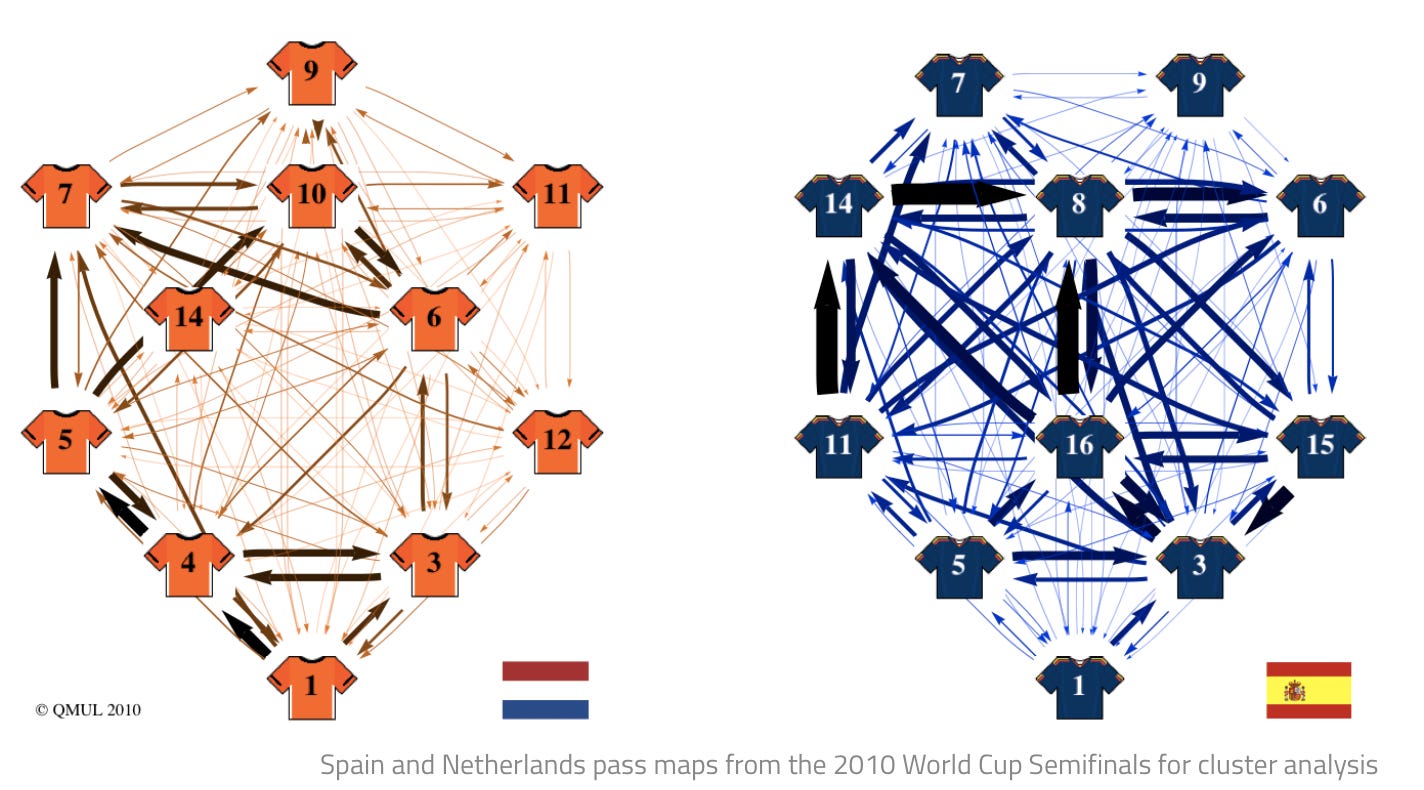
Inspired by the recent World Cup, here’s an example of a graph that shows soccer players (one player is one node) and their pass maps (every edge represents a pass made, with thicker edges meaning more frequent passes):
Networks have a plethora of viable applications, from establishing efficient means of transportation, to finding trends in fashion. However, networks have grown tremendously popular in the social sciences space over the past decade. With the rise of social media and the interconnectedness of our world today more than ever before, networks can be the base of incredibly powerful social analysis.
The networks we function in as humans are fascinating - the connections, size of our communities, and the closeness of our relationships are all powerful indicators of personal and emotional wellbeing, speed of knowledge transfer, and more.
using the elements of a network, we can:
Give a node a weight - ie. ranking an individual as more powerful, having more “followers” or having a certain status versus others
Weight the importance of an edge between two nodes - ie. establishing how strong one connection is versus another
Show one way relationships, with directed networks that can represent a relationship that is not always reciprocal
Find the most central node in a network - like finding a potential hub for an airline
interesting applications of networks science
Minimizing airline costs and making efficient routes for air travel using Dijkstra’s algorithm for shortest paths within a network
Using network analysis to draw connections between an individual’s cognition to “the structures of an individual’s social environments”. (easy to read and a dictionary of network related terms on this linked paper - great for beginners!)
Using networks in social recommender systems to enhance the experience of a first time user on a product.

how can i implement a network of my own?
If you’re interested in testing out the technical implementation of networks, here are some packages to try out.
To build a graph, use the NetworkX package in Python
For an example project, I enjoy this Medium article walkthrough of testing out some NetworkX functionality
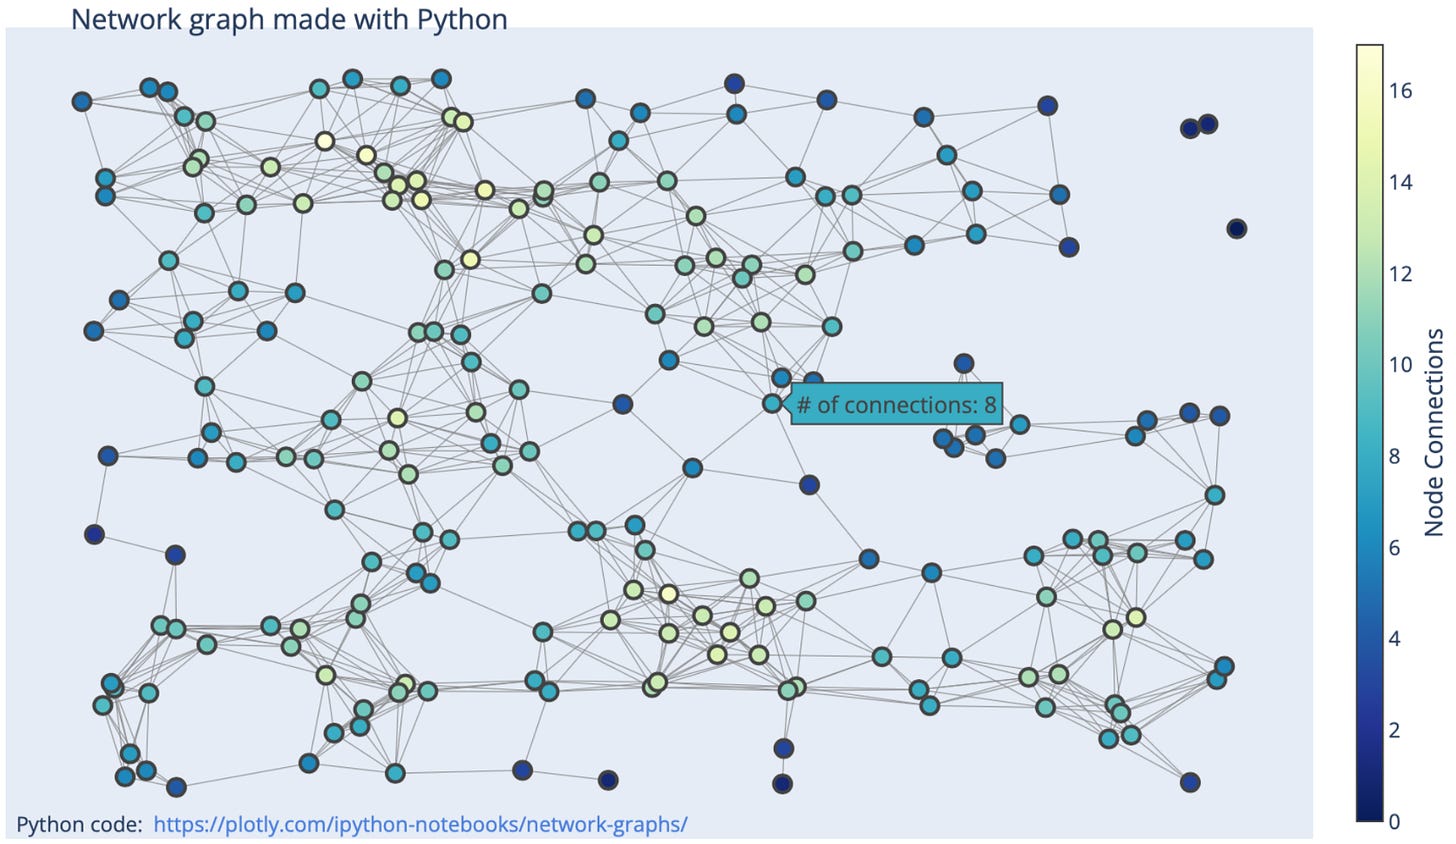
To visualize networks graphs using Python, try using Plotly and NetworkX
It all makes sense now.
So I guess it’s not that weird that we’ve all got a friend in common after all?
I firmly believe network analysis will be on the rise across a variety of technical applications. How can data warehouses better hold graph data? How can data scientists better apply networks to complex problems to build explainable solutions? How can network analysis be applied to simple problems to enhance a user’s experience of a product?
As a data scientist, having foundational knowledge about how networks work and an idea of how they are being applied can enhance your ability to decipher complex data and uncover interesting relationships in your data.
References
Solai Rani P. Application of Graph Theory In Air-Transportation Network. J Pur Appl Math. 2021; 5(1):1:4.
An, H., Park, M. Approaching fashion design trend applications using text mining and semantic network analysis. Fash Text 7, 34 (2020). https://doi.org/10.1186/s40691-020-00221-w
Elisa C Baek, Mason A Porter, Carolyn Parkinson, Social network analysis for social neuroscientists, Social Cognitive and Affective Neuroscience , Volume 16, Issue 8, August 2021, Pages 883–901, https://doi.org/10.1093/scan/nsaa069
Castillejo, E., Almeida, A., López-de-Ipiña, D. (2012). Social Network Analysis Applied to Recommendation Systems: Alleviating the Cold-User Problem. In: Bravo, J., López-de-Ipiña, D., Moya, F. (eds) Ubiquitous Computing and Ambient Intelligence. UCAmI 2012. Lecture Notes in Computer Science, vol 7656. Springer, Berlin, Heidelberg. https://doi.org/10.1007/978-3-642-35377-2_42


