is it good running weather today?
using Strava and OpenWeather to predict if it's "running weather" where you are
This post was previously posted as a Medium article in Feb 2022. I find sample projects to be a great way to learn more about data science, so am excited to share it on this platform as well.
I’ve been using Strava since 2014, tracking my runs and religiously following my friends and professional athletes. I started running in Maryland, then moved to California, then moved to Wisconsin, and now find myself living in New York City. And through the states and all the runs, there is a difference between just any weather and running weather.
So for my January project I decided to tackle a simple idea: can I predict whether it’s great or bad running weather?
Requirements
For this project, you’ll need:
A Strava account, with a “decent” amount of data (decent is a bit subjective. You can start with a small amount, but your model will improve the more runs you have!). Strava didn’t start adding weather data to their runs until June 2020, so there are some limitations already.
A code editor. I used Visual Studio Code for this project.
An OpenWeather account. More on this later.
Data Sources
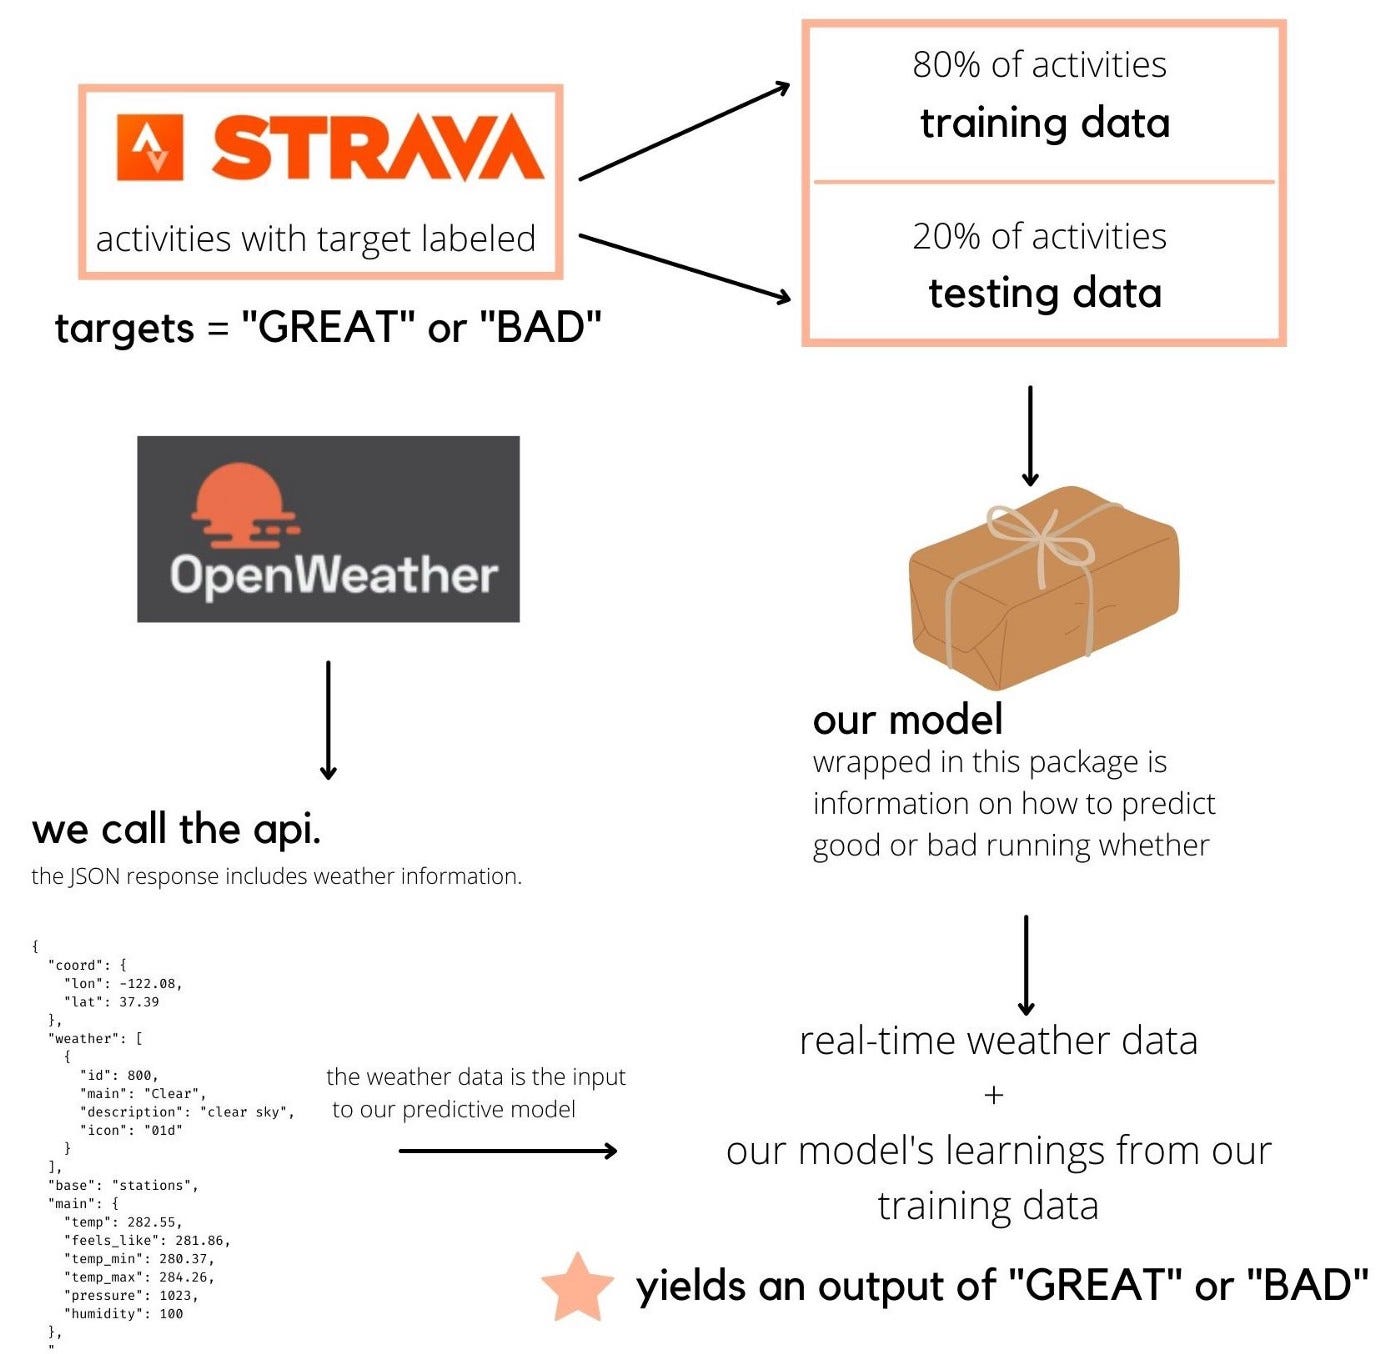
The data for this model will come from two sources. The running data will come from Strava, where users can download archives of their past workouts. The real time weather data will come from the current day data from OpenWeather’s API.
Download Strava Data
The first step of our data gathering is to download an archive of our Strava runs. WARNING: the prompts that you must click before getting to the archive button mention downloading or deleting your account. You won’t delete your account when you request this data. While it’s not my favorite choice on Strava’s user experience side, it is the easiest avenue to get the data we need.
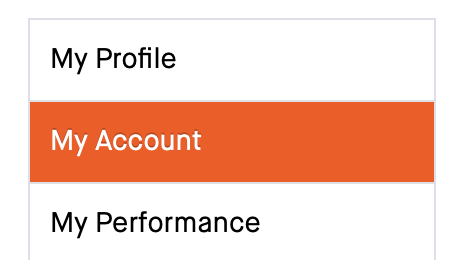
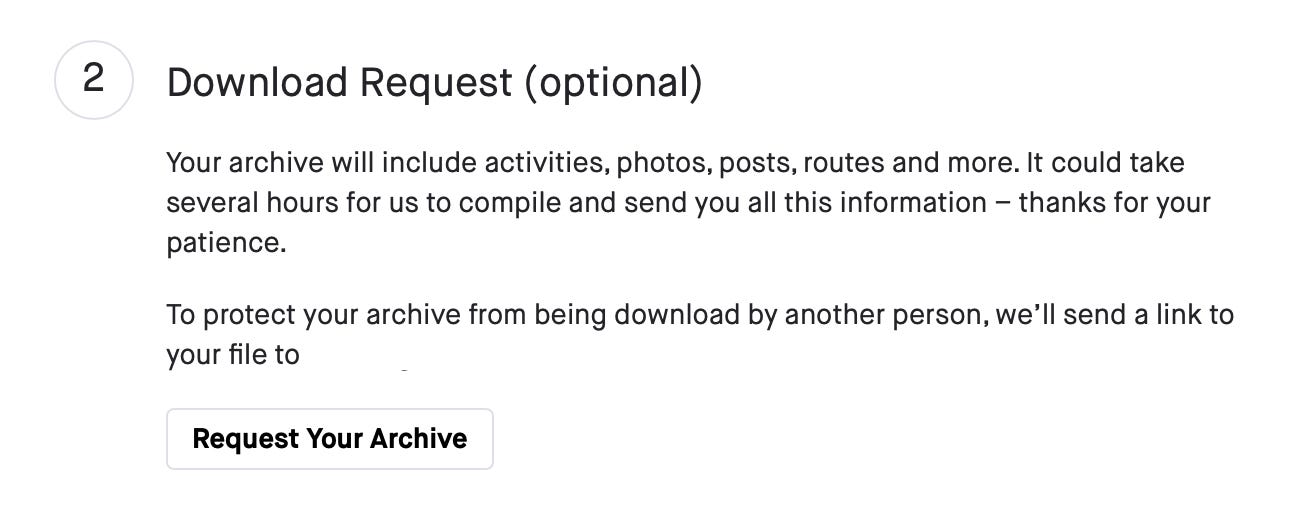
Once signed into your account, navigate to settings, then click “My Account”. From here, click the red “Get Started” to reach the area to download your archive. Under “Download Request”, you should see the “Request Your Archive” button. This will send an email containing the data we need for our project.
Investigating our Strava Data
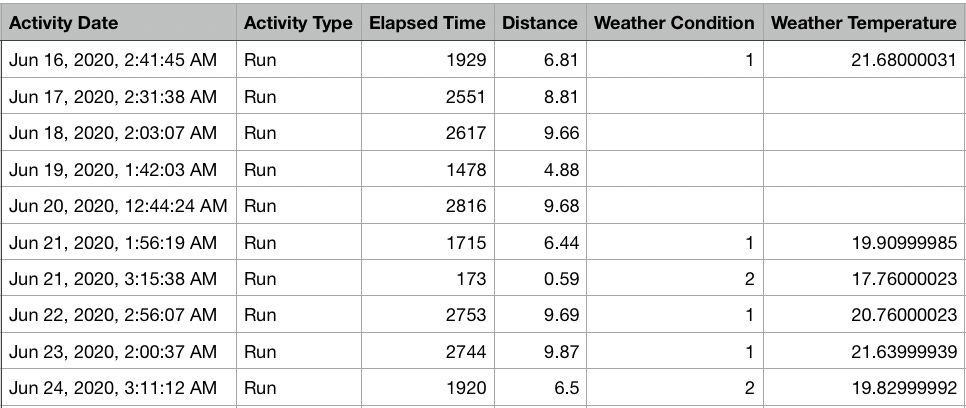
So what’s in this archive? Strava will send a folder with a file inside called “activities.csv”, which is a spreadsheet of all your activities. Each row is an activity, with data points like type of activity, description, title, ID, and weather!
Some things to consider about this data: the weather is only added to outdoor activities. Additionally, there were outdoor activities that I did not see weather data for. So it did leave a bit of room for gaps in data — a note on this in my takeaways.
While there is a variety of data points connected to the weather (listed below), we will only look at a subset of them. This is due to matching the values our API will be sending in. More on that later.
#weather data points in Strava data

Weather Temperature, Apparent Temperature, Dewpoint, Humidity, Wind Speed, Wind Gust, Wind Bearing, Precipitation Intensity, Precipitation Probability, Precipitation Type, Cloud Cover, Weather Visibility, UV Index, Weather Ozone
Labeling Strava Data
Disclaimer: I know the following isn’t the most efficient, technically robust method to data aggregation. But it was fun for me and allowed me to make my model personalized to my interests.
Here’s a sample of what the file Strava gives us looks like.
There’s far more information in this file than what we need for our weather app. I kept only the columns shown in the sample above, as well as the rest of the weather related columns.
Then came the fun part — labeling the runs as “great” or “bad”. In data science, we call this supervised learning. The model is able to know what good running weather and bad running weather looked like in the past and able to predict on new weather conditions in the future. We could have left the data unlabeled and hoped it would learn perhaps due to other factors like my pace or distance, but that wasn’t going to work for my efforts.
So I put on some music and took about 30 minutes to walk down memory lane and label runs as either “great” or “bad”. Lucky for me, I am a very descriptive activity captioner and I had a pretty solid indication of how the weather impacted my run even if it was a year and a half ago. It was a lot of fun relieving some of the good, and not so good, runs I’ve had over the years.
Woohoo! The data is labeled. Now onto building a predictive model.
Building a Model
What type of model is this? This is a supervised machine learning model.
What does “supervised” mean? When using machine learning, there are two types of models that can be developed — supervised or unsupervised. Supervised models use datasets where the metric that is to be predicted has been labeled to learn and make predictions on new data. Unsupervised machine learning models use unlabeled data and try to find trends and learn patterns.
How does this model work? Our labeled Strava dataset will act as our training data. Our model will look at this data and extrapolate information on how the weather inputs impacted my “good” or “bad” tagging. It will use what it learns and be able to apply the findings to new weather data on the fly. We will get real-time city-specific weather data from OpenWeather’s API and alert the user whether it is “good” or “bad” running weather.
What is an API? It stands for “application programming interface”. A good analogy is if you think of an API like a menu. You ask for something off the menu. You aren’t really concerned about how they cook it or what is happening behind the scenes, you just want your food. API’s allow software to communicate. We can politely ask OpenWeather to send us weather data through an API call. They’ll send us back a few data points we can feed into our model. We got our food and we are happy.
For those eager to learn more, I would recommend this article on how to use Python with APIs.
Getting API Results
Practicing integrating API results into a model is an exciting way to up your data science skills. API results empower more “real time” data collection, rather than using what is called static data, like an Excel sheet that does not update on its own.
As I mentioned earlier, the API will let us “get our food”, or rather the data that corresponds to a certain set of parameters. Parameters appear all over data science, as a method to specify and tune models, information, and more. For our application, there are three key metrics in our API “call” — an API key, the unit of measure, and city name. When we ask for data from OpenWeather, we will specify the units we would like that data returned in (metric) and the city we would like the weather data to be from (provided as input from our user).
To use OpenWeather’s API, you must set up an account and get an API key. An API key is a unique ID that authenticates with your project to transfer data. A single user can generate multiple API keys within a program (ie OpenWeather) that each are for a separate project (this running weather app, an app that tells me how many minutes of rain there’s been today, and any other app I would need weather data from OpenWeather to build).
The API key that is generated for our app will be used in our API call.
import streamlit as st
import requestscity_name = st.text_input(“City Name”)url = f”https://api.openweathermap.org/data/2.5/weather?q={city_name}&appid={your_api_key_goes_here}&units=metric"response = requests.get(url)
Developing an App
Now we have our model and can predict for cities on the fly whether there will be good or bad running weather. But how can a user interact with this information?
The answer I’ll be turning to is one of my favorite libraries of all time: Streamlit. It is, in my humble opinion, the fastest way to build and deploy data based applications. It integrates flawlessly with Python and can be quickly deployed using GitHub.
For all the code behind this project, scroll below. Too long of a post for Substack!
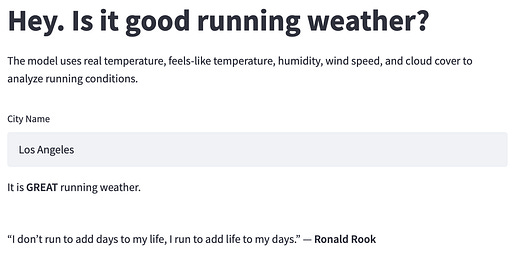
Streamlit packages up all our code, then with a nifty GitLab connection, we can create a user interface like this:
Limitations and Further Improvements
Strava does not provide weather data for runs before June 2020.
The API Strava gathers weather data from has been discontinued for personal use, so the data our API gives us is different than what Strava accounts for. There are improvements to be made in matching more weather features (snowfall, cloud cover, etc.) to increase the model’s performance.
My memory is only so good, so I wasn’t able to perfectly tag all old runs as great or bad. I would like to fix this by keeping track of weather in my Strava descriptions from here on out and updating my training data in the next few months.
This model is REALLY simple to lower the barriers to learning about data science. In real-world modeling, much more validation, tuning, and larger data sets are involved. It’s ok to start small! I’ve added a short few lines of code pertaining to grid search cross validation, and if you’d like to learn more about that, click here.
In order to increase our test data, a smart next step would be to implement a way to identify “great” or “bad” running weather conditions on the fly. Imagine stepping outside to run some errands and saying, “hey, it is GREAT running weather!” You could open an app, click “GREAT” and the weather condition and result would be stored as training data.
This application was made for my personal running weather preferences. If #5 was implemented, an individual would be able to use their own specific preferences to drive predictions.
Conclusion
This project was a lot of fun. I thoroughly enjoyed diving into Strava’s data and finding a way to usefully implement it in my life. I am really eager to continue developing small, simple data science projects to help teach others how easy it is and where we can optimize our own lives a little bit with data science.
Full code can be found here: https://github.com/gabylorenzi/is-it-running-weather
The Streamlit app is deployed here: https://share.streamlit.io/gabylorenzi/is-it-running-weather/main/app.py

