How CitiBike uses data science to keep NYC moving
Demand forecasting and time series model predictions let the people keep biking.
I CitiBike every single day. If you’re not familiar, CitiBike is a shared bike service in New York, with docks around every corner across the city allowing you to get around the boroughs without the stresses of bike ownership. At a price of $205 a year, it makes for a convenient and relatively affordable transportation option to get around one of the most expensive cities in America.
CitiBike has docks all over the city, with anywhere from 20 to 80 docks for bikes. There’s docks in high traffic areas, like near subway stations or right by Central Park, that can struggle to meet demand — either the dock is too full since too many people are looking to park there, or the dock is nearly empty as folks are traveling from the hub to get to other parts of town. It’s a classic tale of supply and demand, having a fixed number of bikes, a set amount of dock spaces, and ever changing amount of demand for dock space and bikes to take out.
Today we’re talking about how CitiBike can use data science to support demand forecasting in their system and efforts they’ve taken to tackle the issue of demand.
the data
CitiBike has publicly been sharing monthly system data, with records back to their launch in 2013, as well as real-time data accessible via API. The monthly data includes information like:
Ride ID
Started at
Ended at
Start station name
End station name
Member ride or casual ride
And more!
With these data points, we can paint a picture of where bikes are moving around the city throughout the day, and capture trends over time to help use data science to predict demand.
exploring the data
Exploratory data analysis (EDA) is a typical beginning step for data scientists when looking at a new dataset or problem. During this time, a data scientist will get familiar with the data by gathering basic statistics of the dataset, like the distribution of values, plotting initial ideas, and making note of any gaps or null values. We’ll do some basic EDA on a dataset from the CitiBike system data.
Using the CitiBike system data and some simple Python code, let’s aggregate all the rides from the past 3 years of data. We’ll get a dataset where each row represents a unique ride taken. Each ride has attributes as mentioned above. During EDA, we’re going to get a sense of the data, any potential issues, and any trends.
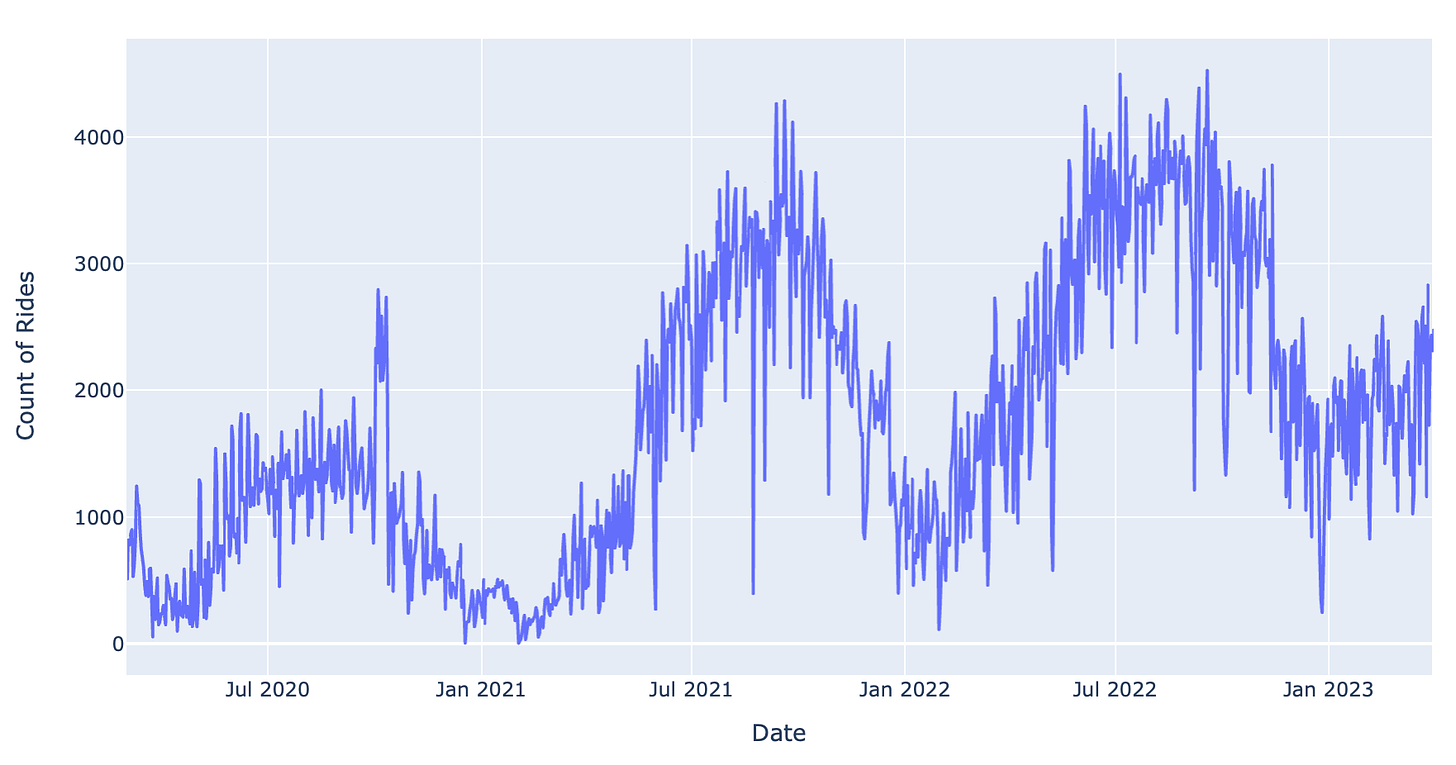
Let’s plot the daily ride totals for every day in our dataset, dating from March 2020 - March 2023.
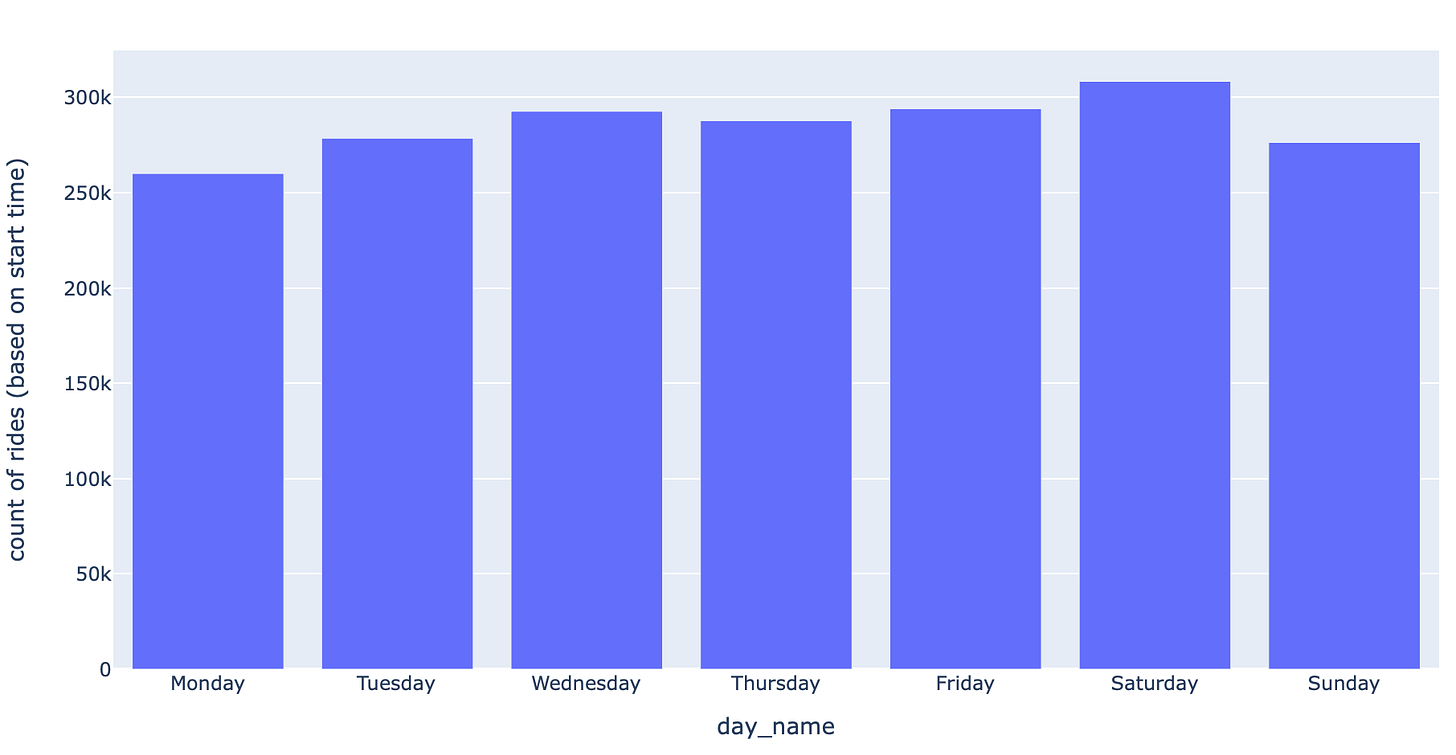
Over the course of our three years of data, let’s see which day of the week is the most popular — looks like Saturday!
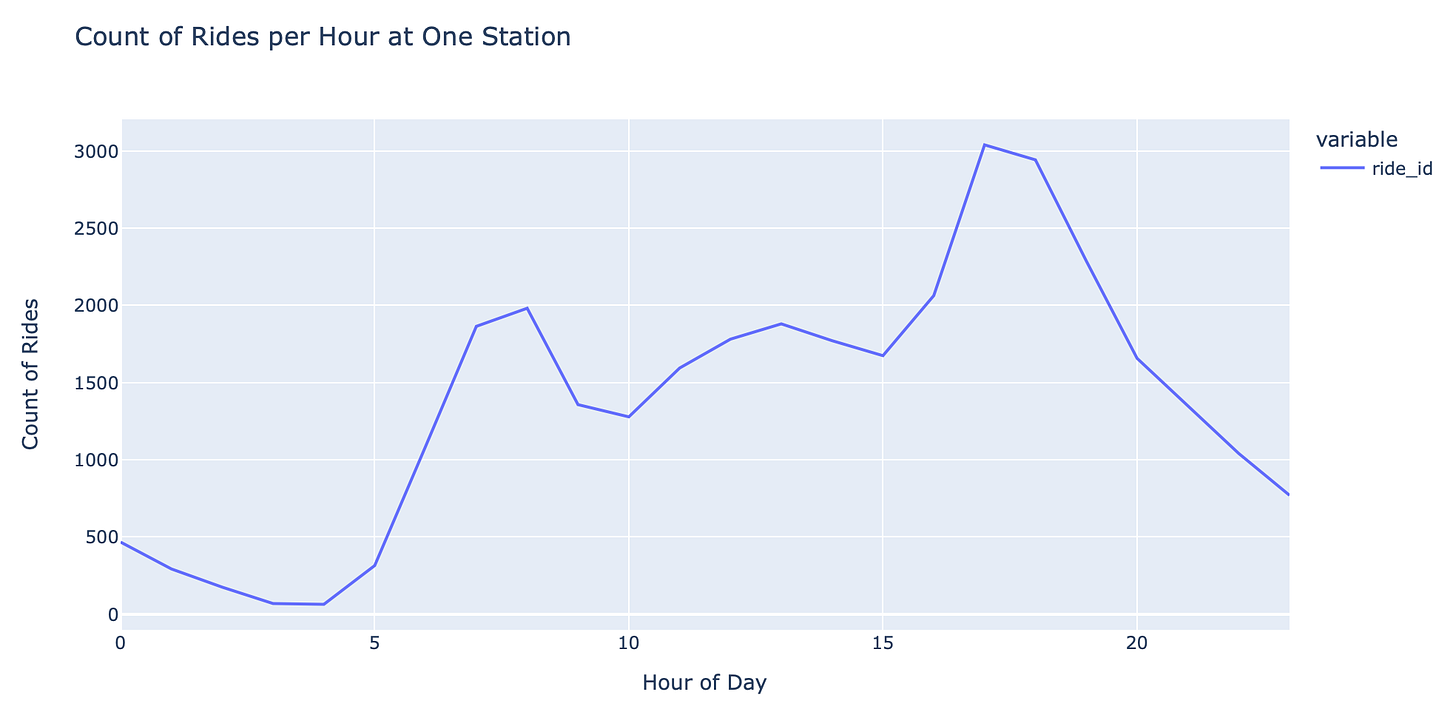
Now let’s see how time of day effects how many rides are taken from a single station — after work appears to be peak hours.
After some EDA, let’s build a simple model.
What are we predicting? The daily count of rides from March 2022 - March 2023.
What data are we using? Daily ride count data from March 2020 - February 2022.
What type of model are we building? We’ll fit an ARIMA model, which stands for Autoregressive Integrated Moving Average. ARIMA models are not always the best model for capturing seasonal data, but we’ll use it since its a simple out of the box model to start using time series.
How do we test performance? We can see how well our model predicted the last year of data points versus the actual values measured for the last year.
With a few lines of code, we can fit an ARIMA model on our first two years of data that is then used to predict the daily number of rides for the last year of our data.
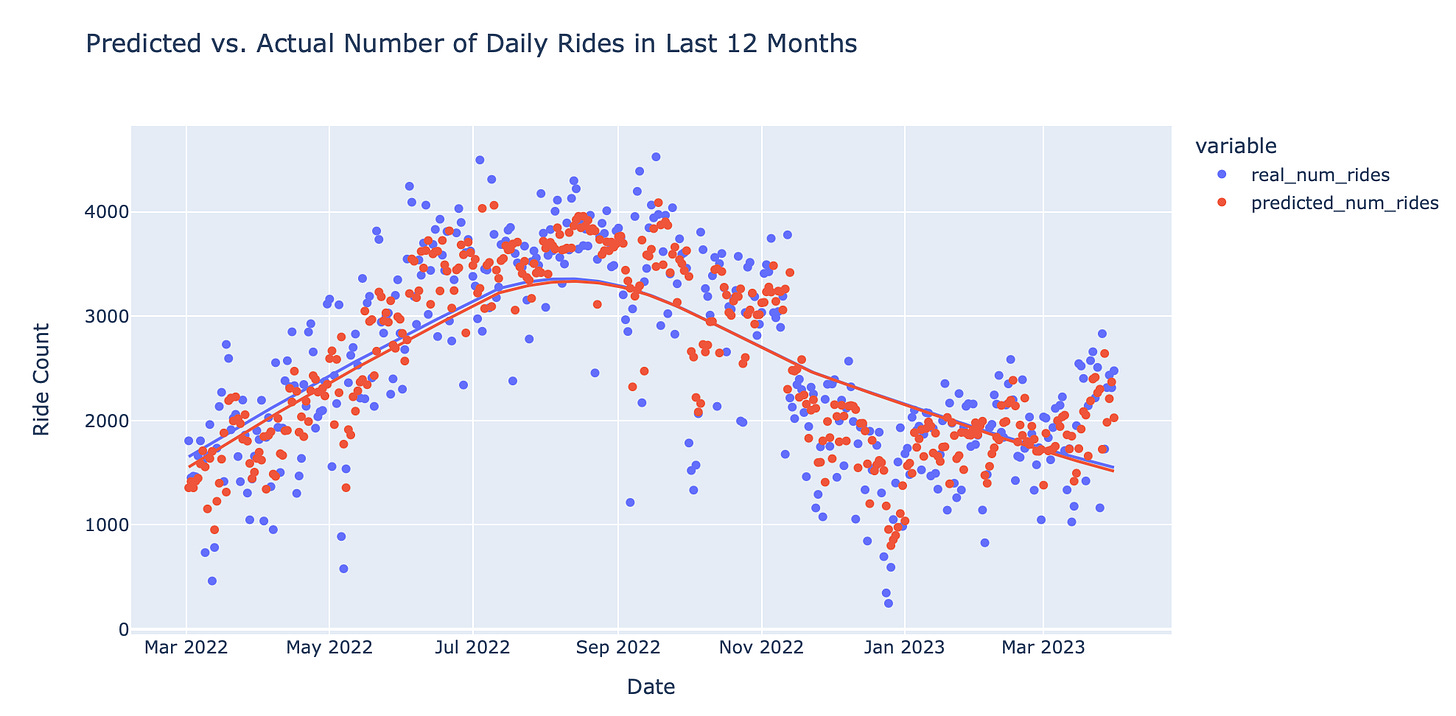
This chart plots the predicted number of daily rides based on the model in red with the real number of daily rides based on the data in blue.
As you can see, the fit lines are very close! Our model performed with a root mean squared error of about 550 rides, meaning we were off on average of 550 rides per test data point (which represented a day in the last year).
While this is exciting, high model performance out of the box is a sign for every budding data scientist to dig into the idea of overfitting, which can be a common problem in the first model any data scientist builds on a new set of data.
For more, check out my code on Github here!
potential next steps
Let’s talk improving our model. There’s a couple of ideas we could implement:
Look into model performance from initial runs
Was there any data leakage? How would the model perform on a different test set? Is the model handling outliers?
Gather data from the start of CitiBike’s launch and the real time feeds.
CitiBike data dates to 2013. More training data typically means a more powerful model.
From my observations, I don’t think CitiBike reports all their data through the output files, so using their API might get more accurate data.
Add in supplementary data to expand our feature set
I bet weather on a given day would be a highly correlated feature to the number rides taken and would help predict spikes/dips. One developer explored this idea in his CitiBike and weather analysis here.
Other data sources that could help indicate demand include population density of the area where a dock is or proximity of dock to a subway station.
how citibike is tackling demand
To move beyond just technical aspects of how data science is used to see trends and make predictions with data, we can see how data science findings are applied to real life solutions companies are using to fill gaps the data has identified.
Despite Manhattan’s population staying relatively constant in the past five years, the demand for CitiBike has grown dramatically. On September 9, 2022, there was 138,372 rides taken, in an all-time record for the company.
The company has launched a few initiatives to help with the rising demand. Two most notably being expanded, staggered docks and their Bike Angel reward system.
staggered docks
These docks can be found in high-demand areas. They’ve taken virtually the same footprint of street space and expanded the number of bikes that can fit by up to 50%. With just a bit of clever design, they’re able to ease strain on high-demand docks. I’ll speak from plenty of experience, ending your ride only to find that there is no space at a dock really kills the satisfaction of a ride. This has saved me plenty of times since its launch in 2022.

bike angels
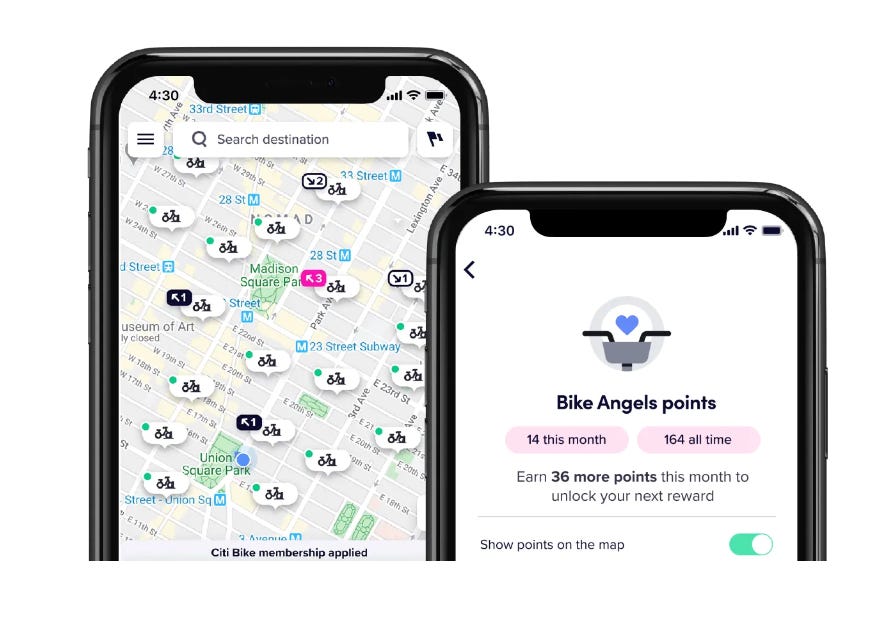
Bike Angels was a program launched by CitiBike to incentivize riders to help make the system work better for everyone by riding bikes from crowded stations to ones that are running low on bikes. For every trip you make as a Bike Angel, you accumulate points, with some rides being worth more points than others. The value of these rides most likely is determined by data science using demand forecasting to predict which stations need bikes more than others. These points then convert into rewards, like free E-bike rides and membership extensions. I’ve been an avid Bike Angel-er and earned several free weeks of membership extension, making the price of CitiBike even cheaper. The Bike Angels program is a great example of a circular reward program that benefits users and helps keep supply and demand in check.
fun fact:
One New Yorker took his commute to the extreme, biking from New York to Santa Monica, California, pushing far beyond the limits of CitiBike’s $1,200 late fee for bikes not in the system after 24 hours.
Thanks for reading this week! See you all next time.


Fascinating analysis of the data, coupled with an engaging write up of the data to present a clear, concise picture from the hundreds and hundreds of millions of data points.